Vestibulum iaculis consectetur convallis. Donec sit amet congue massa. Quisque nec eros eu dolor posuere fermentum et vel nulla. Donec mollis leo sit amet egestas vulputate. Etiam eget ante ante. Proin dignissim justo vel nibh tincidunt, a porta dui tincidunt. Ut varius, metus ac luctus molestie, turpis magna ultricies lectus, at ornare tellus diam sit amet risus. In hac habitasse platea dictumst. Vestibulum ante ipsum primis in faucibus orci luctus et ultrices posuere cubilia Curae; Vivamus neque dui, placerat ac massa nec, rutrum rhoncus ex. Sed ut posuere urna.
In the previous article we provided a reference of available configuration options for migrate source plugins. In today’s article we are doing something similar for destination plugins. We will present a reference of available configuration options for migrate destination plugins provided by Drupal core and some contributed modules. Knowing which options are available might require some Drupal development knowledge. By providing this reference it should make the process of writing migrations easier.
For each migrate destination plugin we will present: the module that provides it, the class that defines it, the class that the plugin extends, and any inherited options from the class hierarchy. For each plugin configuration option we will list its name, type, a description, and a note if it is optional.
DestinationBase (abstract class)
Module: Migrate (Drupal Core)
Class: Drupal\migrate\Plugin\migrate\destination\DestinationBase
Extends: Drupal\Core\Plugin\PluginBase
This abstract class is extended by many migrate destination plugins. This means that the provided configuration keys apply to any destination plugin extending it.
List of configuration keys:
- destination_module: An optional string value. Identifies the module handling the destination data. If not set, the Migrate API tries to read the value from the destination plugin definition.
Entity (abstract class)
Module: Migrate (Drupal Core) Plugin ID: entity:$entity_type See below.
Class: Drupal\migrate\Plugin\migrate\destination\Entity
Extends: Drupal\migrate\Plugin\migrate\destination\DestinationBase
Inherited configuration options: destination_module.
Related article: Drupal migrations reference: List of properties per content entity
This abstract class is extended by migrate destination plugins that want to import entities. It uses the MigrateEntity derivative to handle both content and configuration entities. The derivative sets the plugin ID to entity:$entity_type where $entity_type is the machine name of the entity. For example, entity:node and entity:node_type.
By default, content entities are handled by the EntityContentBase class while configuration entities use EntityConfigBase. Some entities like user (content) and node type (configuration) use specific classes for the import operation. The DefaultPluginManager::getDefinitions method triggers the search for classes that will override the default for a particular plugin ID. The override ultimately happens in the DerivativeDiscoveryDecorator::getDerivatives method.
In addition to the keys provided in the parent class chain, this abstract class provides the following configuration keys, which will be available to its derivatives:
- default_bundle: An optional string value. Gets the bundle for the row taking into account the default. If not present, the bundle entity key should be set in the process section for entities that can have more than one bundle. For example, the type property for nodes, the vid property for taxonomy terms, and the bundle property for media entities.
EntityContentBase
Module: Migrate (Drupal Core) Plugin ID: entity:$entity_type See below.
Class: Drupal\migrate\Plugin\migrate\destination\EntityContentBase
Extends: Drupal\migrate\Plugin\migrate\destination\Entity
Inherited configuration options: destination_module and default_bundle.
This class is used to handle import operations for all content entities, unless a specific class exists for the plugin ID being used. For example, nodes are handled by this class, but users leverage the EntityUser class. The MigrateEntity derivative sets the plugin ID to entity:$entity_type where $entity_type is the machine name of the content entity. For example, entity:node, entity:user, entity:taxonomy_term, entity:file, entity:media, entity:comment, entity:block_content, and entity:contact_message.
In addition to the keys provided in the parent class chain, this class provides the following configuration keys:
- translations: An optional boolean value. It indicates if the entity is translatable, defaults to FALSE. If set to TRUE, the corresponding langcode entity key will be added to the list of destination IDs that uniquely identifies each record. If the migration itself does not provide a value for the langcode property, the site’s default language is used.
- overwrite_properties: An optional array of string values. It is a list of properties or fields in the destination entity that will be overwritten if an entity with the same ID already exists. Any properties that are not listed will not be overwritten. Refer to the class documentation for an example.
- validate: An optional boolean value. It indicates whether an entity should be validated, defaults to FALSE. This was introduced in Drupal 8.8 and can be used to prevent invalid entities from being migrated. For example, a node with an empty title would fail validation. A required field that is not set by the migration will trigger a validation error, unless the field is configured to have a default value. Similarly, an integer field with minimum and maximum values will trigger an error if a value outside that range tries to be imported. Field API validations are triggered when this configuration option is set to TRUE.
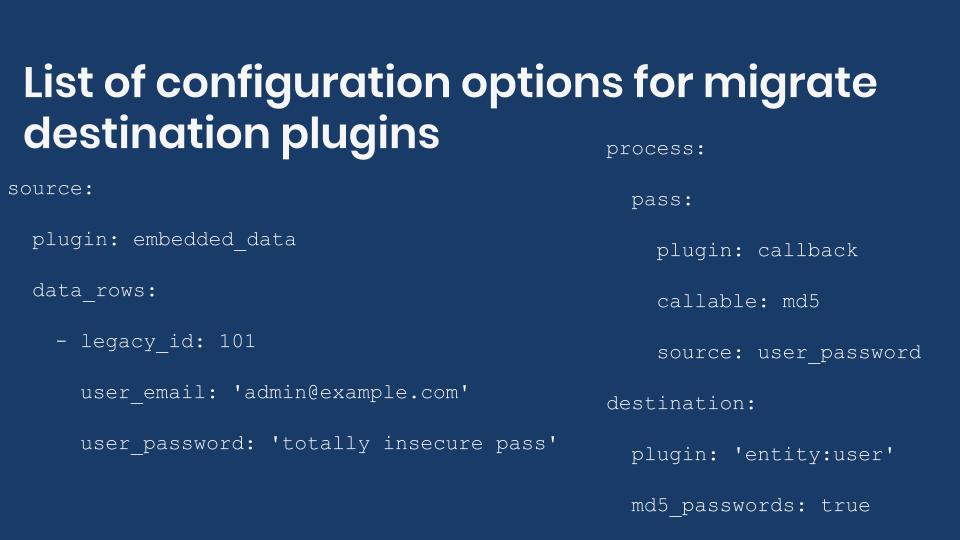
EntityUser
Module: User (Drupal Core) Plugin ID: entity:user See below.
Class: Drupal\user\Plugin\migrate\destination\EntityUser
Extends: Drupal\migrate\Plugin\migrate\destination\EntityContentBase
Inherited configuration options: destination_module, default_bundle, translations, overwrite_properties, and validate.
This class provides a destination plugin for migrating user entities. It performs extra checks like preventing that the password for user 1 is overridden by the migration.
In addition to the keys provided in the parent class chain, this abstract class provides the following configuration keys:
- md5_passwords: An optional boolean value. If set to TRUE, the pass (password) property of the user entity is assumed to contain an MD5 hash. The passwords will be salted and re-hashed before they are saved to the destination Drupal database.
EntityRevision
Module: Migrate (Drupal Core) Plugin ID: entity_revision:$entity_type See below.
Class: Drupal\migrate\Plugin\migrate\destination\EntityRevision
Extends: Drupal\migrate\Plugin\migrate\destination\EntityContentBase
Inherited configuration options: destination_module, default_bundle, translations, overwrite_properties, and validate.
This class provides an entity revision destination plugin. Only revisionable entities, those that define a revision entity key, can use this destination plugin. It uses the MigrateEntityRevision derivative which sets the plugin ID to entity_revision:$entity_type where $entity_type is the machine name of the entity. For example, entity_revision:node whose revision key is vid and entity_revision:block_content whose revision key is revision_id.
Entity revisions can only be migrated after the entity to which they belong has been migrated. For example, revisions of a given node (entity_revision:node destination migration) can be migrated only after the current version of that node (entity:node destination migration) has been imported.
EntityReferenceRevisions
Module: Entity Reference Revisions module Plugin ID: entity_reference_revisions:$entity_type See below.
Class: Drupal\entity_reference_revisions\Plugin\migrate\destination\EntityReferenceRevisions
Extends: Drupal\migrate\Plugin\migrate\destination\EntityRevision
Inherited configuration options: destination_module, default_bundle, translations, overwrite_properties, and validate.
Related article: Introduction to paragraphs migrations in Drupal
This class provides an entity revision revision destination plugin. It uses the MigrateEntityReferenceRevisions derivative which sets the plugin ID to entity_reference_revisions:$entity_type where $entity_type is the machine name of the entity. For example, entity_reference_revisions:node and entity_reference_revisions:paragraph. For example, entity_reference_revisions:node whose revision key is vid and entity_reference_revisions:paragraph whose revision key is revision_id.
This is the destination plugin used for migrating Paragraphs. Entity reference fields are no longer supported to reference Paragraphs. Instead, entity entity reference revisions must be used. Therefore, this class is used for paragraphs migrations with the entity_reference_revisions:paragraph plugin ID. See this article for an example on how to migrate paragraphs.
In addition to the keys provided in the parent class chain, this abstract class provides the following configuration keys:
- new_revisions: An optional boolean value. Flag to indicate if a new revision should be created instead of updating a previous default record. Only applicable when providing an entity id without a revision_id. Defaults to FALSE.
EntityConfigBase
Module: Migrate (Drupal Core) Plugin ID: entity:$entity_id See below.
Class: Drupal\migrate\Plugin\migrate\destination\EntityConfigBase
Extends: Drupal\migrate\Plugin\migrate\destination\Entity
Inherited configuration options: destination_module and default_bundle.
This class is used to handle import operations for all configuration entities, unless a specific class exists for the plugin ID being used. For example, taxonomy vocabularies are handled by this class, but node types leverage the EntityNodeType class. The MigrateEntity derivative sets the plugin ID to entity:$entity_type where $entity_type is the machine name of the content entity. For example, entity:node_type, entity:user_role, entity:taxonomy_vocabulary, entity:block, entity:comment_type, entity:block_content_type, entity:contact_form, entity:date_format.
In addition to the keys provided in the parent class chain, this abstract class provides the following configuration keys:
- translations: An optional boolean value. if TRUE, the destination will be associated with the langcode provided by the source plugin. Defaults to FALSE. For example: en for English, es for Spanish, and fr for French.
EntityNodeType
Module: Node (Drupal Core) Plugin ID: entity:node_type
Class: Drupal\node\Plugin\migrate\destination\EntityNodeType
Extends: Drupal\migrate\Plugin\migrate\destination\EntityConfigBase
Inherited configuration options: destination_module, default_bundle, and translations.
This class is used to import node types. It does not take extra configuration options. The plugin overrides the import method to attach the body field to the imported content type. This depends on the presence of certain destination properties in the imported row. That is, the following properties needs to be mapped in the process section of the migration:
- create_body: An optional boolean value. If TRUE, a body field will be added to the content type.
- create_body_label: An optional string value. If set and create_body is TRUE, the value for this destination property will be used as the label of the body field.
Config
Module: Migrate (Drupal Core) Plugin ID: config
Class: Drupal\migrate\Plugin\migrate\destination\Config
Extends: Drupal\migrate\Plugin\migrate\destination\DestinationBase
Inherited configuration options: destination_module.
This class persists data to the configuration management system. In addition to the keys provided in the parent class chain, this class provides the following configuration keys:
- store null: An optional boolean value. If TRUE, when a property is NULL, the NULL value is stored. Otherwise, the default value is used. Defaults to FALSE. Note that there is a space character in the configuration name.
- translations: An optional boolean value. if TRUE, the destination will be associated with the langcode provided by the source plugin. Defaults to FALSE.
Additionally, the plugin expects certain destination properties in the imported row. That is, the following properties needs to be mapped in the process section of the migration:
- config_name: A string value. The machine name of the configuration. For example: node.settings, node.type.article, user.settings, system.site, and core.extension.
- langcode: An optional string value. The language code of the configuration. For example: en for English, es for Spanish, and fr for French.
Table
Module: Migrate Plus Plugin ID: table
Class: Drupal\migrate_plus\Plugin\migrate\destination\Table
Extends: Drupal\migrate\Plugin\migrate\destination\DestinationBase
Inherited configuration options: destination_module.
This class allows you to write directly to a table not registered with Drupal Schema API. See this test for an example on how to use this plugin.
In addition to the keys provided in the parent class chain, this class provides the following configuration keys:
- database_key: An string value. Key for the database connection used for inserting records. See this documentation page for more information on database connection keys. We also covered the topic when explaining the SqlBase source plugin.
- table_name: An string value. Name of the table where records will be imported.
- batch_size: An optional integer value. Maximum number of rows to insert in one query. Defaults to 1.
- id_fields: An associative array value. Fields used to uniquely identify table rows. At least one field is required. See the class’s docblock for an example of the expected structure.
- fields: An optional associative array value. Mapping of column names to values set in the process section.
Available configuration for other migrate destination plugins
In Drupal core itself there are around 50 migrate destination plugins. And many more are made available by contributed modules. It would be impractical to document them all here. To get a list by yourself, load the plugin.manager.migrate.destination service and call its getDefinitions() method. This will return all migrate destination plugins provided by the modules that are currently enabled on the site. This Drush command would get the list:
# List of migrate destination plugin definitions. $ drush php:eval "print_r(\Drupal::service('plugin.manager.migrate.destination')->getDefinitions());" # List of migrate destination plugin ids. $ drush php:eval "print_r(array_keys(\Drupal::service('plugin.manager.migrate.destination')->getDefinitions()));"
To find out which configuration options are available for any destination plugin consider the following:
- Find the class that defines the plugin and find out which configuration values are read. Some plugins even include the list in the docblock of the class. Search for a pattern similar to $this->configuration['option_name'] or $configuration['option_name']. The plugins can be found in the Drupal\module_name\Plugin\migrate\destination namespace. The class itself would be in a file under the /src/Plugin/migrate/destination/ directory of the module.
- Look up in the class hierarchy. The destination plugin can use any configuration set directly in its definition class and any parent class. There might be multiple layers of inheritance.
- Check if the plugin requires the presence of specific destination properties to be set in the process section. This is usually documented in the class’ docblock, but you can also look for code like $row->getDestinationProperty('property_name').
What did you learn in today’s article? Did you know that migrate destination plugins can inherit configuration keys from their class hierarchy? Were you aware that there are so many destination plugins? Other than the ones listed here, which destination plugins have you used? Please share your answers in the comments. Also, we would be grateful if you shared this article with your friends and colleagues.
Oh yeah!
I'm back! Because I knew this blog post wasn't quite long enough already...certainly not because it occurred to me that I left off another alternative I've used in a pinch.
The one-off
If you want to run a command using a different version of php, rather than rely on the shebang, you can always just call the desired script as an argument to php itself. When you run, e.g. drush status, your shell sees the #! on the first line, and uses that as the default interpreter for the script. In essence, your command is translated into /usr/bin/env php drush status.
Rather than accept this default, you can specify the specific version on your command line, such as php8.1 drush status. In this case the #! is just ignored. Unfortunately, this method can only get you so far - particularly with drush. Drush often figures out what your command requires and in turn will spawn other php scripts to do the dirty work. These spawned scripts are unaware of the interpreter that drush itself was started with.
Results
Thanks to the updated CoLab sites, NICHQ Staff are now collaborating more effectively. By including users from the beginning with surveys and interviews we were able to update their software with exactly the features they need. Doing so on a distribution has empowered their team to deploy new sites and improve existing ones as CoLabs grow.
Ben spoke most recently on this topic at DrupalCon Seattle and Drupal Camp Twin Cities, both in 2019, about how Drupal as a Service can save our livelihoods and our lives. Here are some resources related to the talk and topic.

The Earth is not dying, it is being killed, and those who are killing it have names and addresses.
Utah Phillips
As far as i can tell, the Internet hasn't sourced that quotation, but no one challenges that it was Phillips— and i thought i heard him say about the same thing on the radio, in a broadcast where he also slammed NPR, boosting community radio and, if needed, the do-it-yourself be-the-media ethos. Maybe i'm part of a collective delusion, in which case, i'm sure Utah Phillips wouldn't care one way or another so long as we got on with working for the liberation of humanity and preserving life on planet Earth as part of that.
Sources cited
- Usage statistics for the core Drupal project
- Sony Music 2009 sponsorship of major multilingual improvements
- Police killing of Korryn Gaines after Facebook shut off her livestream
- Aftermath of police killing of Korryn Gaines
- How markets co-opted Free Software's most powerful weapon (Benjamin Mako Hill talk at LibrePlanet)
Crowd-sourcing this on Mastodon (itself interestingly compatible with LibreSaaS with instances like social.coop working on governance models, if not yet having the revenue to cover hosting, let alone contribute back to development:
Hello fediverse, what online tools do you know about that are LibreSaaS— you can pay to use them, but the full stack is free/libre open source software so you or others can totally host the entire thing yourself if you want?
I added whichever answers i didn't already have to the LibreSaaS list pad.
We'll keep looking for ways that cooperation can save us all (and technology can help) so sign up to get (extremely occasional, less than once a year) updates.
Envíenos un correo electrónico a preguntar@agaric.coop, llámenos al +1 508 283 3557, o use este formulario a continuación, y uno de los trabajadores-propietarios de Agaric se comunicará con usted.
Lorem ipsum dolor sit amet, consectetur adipiscing elit. Maecenas tempus, nibh non finibus sollicitudin, ligula magna tempus nibh, ut maximus libero lorem ut sem. Nunc tincidunt sit amet enim in euismod. Fusce dignissim feugiat bibendum. Aliquam erat volutpat. Aliquam eu sem id nulla varius scelerisque et sit amet ipsum. Nulla scelerisque vestibulum felis, a porttitor turpis imperdiet nec. Nam id laoreet nibh. Aenean quis elit cursus, vehicula nibh a, aliquam mauris. Vestibulum facilisis vestibulum cursus. Pellentesque auctor libero id condimentum commodo. Suspendisse potenti. Maecenas diam sem, ornare in ex porttitor, euismod lacinia dolor. Vestibulum ante ipsum primis in faucibus orci luctus et ultrices posuere cubilia Curae; Sed sollicitudin fermentum massa. Sed et ipsum nec massa consequat lobortis sed non quam. Donec rhoncus condimentum quam sed gravida.
We are experts in Drupal migrations. We can move content from your old site to your Drupal 8, 9, or 10 site so that you can keep working with all of your old content, all while gaining access to the flexibility, functionality, and forward-compatibility of modern Drupal.
Perhaps most important, while helping improve your content architecture and moving everything to your upgraded site, we will preserve your old site's SEO, which may have been years in the making. Agaric migrations keeps crucial paths on your site—which have been indexed by search engines, linked to from around the web, and bookmarked by your visitors—working or redirected to equivalent content.
Whether you are merging seven types of content containers (that were all basically blog posts) into one—or splitting a ninety field complex posting form into different content types with appropriate functionality for different purposes—we make your old content work the way you want to work now. By improving your old content, not only improving your website around it, you gain the flexibility to repurpose the old content for the lengthening tail of new ways of using old content. Devices and channels are continually changing, and it's not just about displaying content any more. Audio formats are increasingly popular, and providing access to your content as data, to be remixed or related to other content can make your website content much more than an archive. We bring your old content into new environments where its value can be unlocked.
The professionals come to us
Other (excellent!) web development shops often contract out to us for help with the content migration portion of site rebuilds and rebrands that they are working on, especially the hardest parts.
Similarly, clients will hire us for capacity building for migrations specifically. Agaric can provide a combination of services to give you the ability to get your website upgrade done well and efficiently. For example, we can train internal staff to be able to take on more migration and development work, without needing us. And we can also, at the same time, take on the most complex parts of the migration that do not seem likely to need repeating, or we can help where you get stuck.
Dan left Agaric in 2011 to go forth on his own, leaving behind some famous quotations:
Like a nine-year-old in high school.
And:
That's why you'll be a small seller of custom drupal pretzels...
So far we have learned how to write basic Drupal migrations and use process plugins to transform data to meet the format expected by the destination. In the previous entry we learned one of many approaches to migrating images. In today’s example, we will change it a bit to introduce two new migration concepts: constants and pseudofields. Both can be used as data placeholders in the migration timeline. Along with other process plugins, they allow you to build dynamic values that can be used as part of the migrate process pipeline.
Setting and using constants
In the Migrate API, a constant is an arbitrary value that can be used later in the process pipeline. They are set as direct children of the source section. You write a constants key whose value is a list of name-value pairs. Even though they are defined in the source section, they are independent of the particular source plugin in use. The following code snippet shows a generalization for settings and using constants:
source:
  constants:
    MY_STRING: 'http://understanddrupal.com'
    MY_INTEGER: 31
    MY_DECIMAL: 3.1415927
    MY_ARRAY:
      - 'dinarcon'
      - 'dinartecc'
  plugin: source_plugin_name
  source_plugin_config_1: source_config_value_1
  source_plugin_config_2: source_config_value_2
process:
  process_destination_1: constants/MY_INTEGER
  process_destination_2:
    plugin: concat
    source: constants/MY_ARRAY
    delimiter: ' '
You can set as many constants as you need. Although not required by the API, it is a common convention to write the constant names in all uppercase and using underscores (_) to separate words. The value can be set to anything you need to use later. In the example above, there are strings, integers, decimals, and arrays. To use a constant in the process section you type its name, just like any other column provided by the source plugin. Note that you use the constant you need to name the full hierarchy under the source section. That is, the word constant and the name itself separated by a slash (/) symbol. They can be used to copy their value directly to the destination or as part of any process plugin configuration.
Technical note: The word constants for storing the values in the source section is not special. You can use any word you want as long as it does not collide with another configuration key of your particular source plugin. A reason to use a different name is that your source actually contains a column named constants. In that case you could use defaults or something else. The one restriction is that whatever value you use, you have to use it in the process section to refer to any constant. For example:
source:
  defaults:
    MY_VALUE: 'http://understanddrupal.com'
  plugin: source_plugin_name
  source_plugin_config: source_config_value
process:
  process_destination: defaults/MY_VALUE
Setting and using pseudofields
Similar to constants, pseudofields stores arbitrary values for use later in the process pipeline. There are some key differences. Pseudofields are set in the process section. The name is arbitrary as long as it does not conflict with a property name or field name of the destination. The value can be set to a verbatim copy from the source (a column or a constant) or they can use process plugins for data transformations. The following code snippet shows a generalization for settings and using pseudofields:
source:
  constants:
    MY_BASE_URL: 'http://understanddrupal.com'
  plugin: source_plugin_name
  source_plugin_config_1: source_config_value_1
  source_plugin_config_2: source_config_value_2
process:
  title: source_column_title
  my_pseudofield_1:
    plugin: concat
    source:
      - constants/MY_BASE_URL
      - source_column_relative_url
    delimiter: '/'
  my_pseudofield_2:
    plugin: urlencode
    source: '@my_pseudofield_1'
  field_link/uri: '@my_pseudofield_2'
  field_link/title: '@title'
In the above example, my_pseudofield_1 is set to the result of a concat process transformation that joins a constant and a column from the source section. The result value is later used as part of a urlencode process transformation. Note that to use the value from my_pseudofield_1 you have to enclose it in quotes (') and prepend an at sign (@) to the name. The new value obtained from URL encode operation is stored in my_pseudofield_2. This last pseudofield is used to set the value of the URI subfield for field_link. The example could be simplified, for example, by using a single pseudofield and chaining process plugins. It is presented that way to demonstrate that a pseudofield could be used as direct assignments or as part of process plugin configuration values.
Technical note: If the name of the subfield can be arbitrary, how can you prevent name clashes with destination property names and field names? You might have to look at the source for the entity and the configuration of the bundle. In the case of a node migration, look at the baseFieldDefinitions() method of the Node class for a list of property names. Be mindful of class inheritance and method overriding. For a list of fields and their machine names, look at the “Manage fields” section of the content type you are migrating into. The Field API prefixes any field created via the administration interface with the string field_. This reduces the likelihood of name clashes. Other than these two name restrictions, anything else can be used. In this case, the Migrate API will eventually perform an entity save operation which will discard the pseudofields.
Understanding Drupal Migrate API process pipeline
The migrate process pipeline is a mechanism by which the value of any destination property, field, or pseudofield that has been set can be used by anything defined later in the process section. The fact that using a pseudofield requires to enclose its name in quotes and prepend an at sign is actually a requirement of the process pipeline. Let’s see some examples using a node migration:
- To use the title property of the node entity, you would write @title
- To use the field_body field of the Basic page content type, you would write @field_body
- To use the my_temp_value pseudofield, you would write @my_temp_value
In the process pipeline, these values can be used just like constants and columns from the source. The only restriction is that they need to be set before being used. For those familiar with the rewrite results feature of Views, it follows the same idea. You have access to everything defined previously. Anytime you use enclose a name in quotes and prepend it with an at sign, you are telling the migrate API to look for that element in the process section instead of the source section.
Migrating images using the image_import plugin
Let’s practice the concepts of constants, pseudofields, and the migrate process pipeline by modifying the example of the previous entry. The Migrate Files module provides another process plugin named image_import that allows you to directly set all the subfield values in the plugin configuration itself.
As in previous examples, we will create a new module and write a migration definition file to perform the migration. It is assumed that Drupal was installed using the standard installation profile. The code snippets will be compact to focus on particular elements of the migration. The full code is available at https://github.com/dinarcon/ud_migrations The module name is UD Migration constants and pseudofields and its machine name is ud_migrations_constants_pseudofields. The id of the example migration is udm_constants_pseudofields. Refer to this article for instructions on how to enable the module and run the migration. Make sure to download and enable the Migrate Files module. Otherwise, you will get an error like: “In DiscoveryTrait.php line 53: The "file_import" plugin does not exist. Valid plugin IDs for Drupal\migrate\Plugin\MigratePluginManager are:...”. Let’s see part of the source definition:
source:
constants:
BASE_URL: 'https://agaric.coop'
PHOTO_DESCRIPTION_PREFIX: 'Photo of'
plugin: embedded_data
data_rows:
-
unique_id: 1
name: 'Michele Metts'
photo_url: 'sites/default/files/2018-12/micky-cropped.jpg'
photo_width: '587'
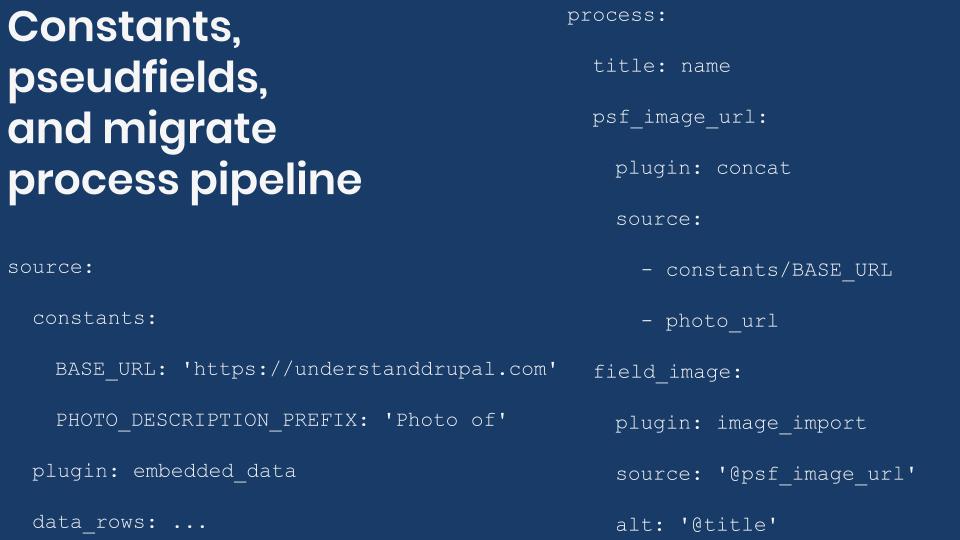
photo_height: '657'Only one record is presented to keep snippet short, but more exist. In addition to having a unique identifier, each record includes a name, a short profile, and details about the image. Note that this time, the photo_url does not provide an absolute URL. Instead, it is a relative path from the domain hosting the images. In this example, the domain is https://agaric.coop so that value is stored in the BASE_URL constant which is later used to assemble a valid absolute URL to the image. Also, there is no photo description, but one can be created by concatenating some strings. The PHOTO_DESCRIPTION_PREFIX constant stores the prefix to add to the name to create a photo description. Now, let’s see the process definition:
process:
  title: name
  psf_image_url:
    plugin: concat
    source:
      - constants/BASE_URL
      - photo_url
    delimiter: '/'
  psf_image_description:
    plugin: concat
    source:
      - constants/PHOTO_DESCRIPTION_PREFIX
      - name
    delimiter: ' '
  field_image:
    plugin: image_import
    source: '@psf_image_url'
    reuse: TRUE
    alt: '@psf_image_description'
    title: '@title'
    width: photo_width
    height: photo_height
The title node property is set directly to the value of the name column from the source. Then, two pseudofields. psf_image_url stores a valid absolute URL to the image using the BASE_URL constant and the photo_url column from the source. psf_image_description uses the PHOTO_DESCRIPTION_PREFIX constant and the name column from the source to store a description for the image.
For the field_image field, the image_import plugin is used. This time, the subfields are not set manually. Instead, they are assigned using plugin configuration keys. The absence of the id_only configuration allows for this. The URL to the image is set in the source key and uses the psf_image_url pseudofield. The alt key allows you to set the alternative attribute for the image and in this case the psf_image_description pseudofield is used. For the title subfield sets the text of a subfield with the same name and in this case it is assigned the value of the title node property which was set at the beginning of the process pipeline. Remember that not only psedufields are available. Finally, the width and height configuration uses the columns from the source to set the values of the corresponding subfields.
What did you learn in today’s blog post? Did you know you can define constants in your source as data placeholders for use in the process section? Were you aware that pseudofields can be created in the process section to store intermediary data for process definitions that come next? Have you ever wondered what is the migration process pipeline and how it works? Please share your answers in the comments. Also, I would be grateful if you shared this blog post with your colleagues.
Next: Tips for writing Drupal migrations and understanding their workflow
This blog post series, cross-posted at UnderstandDrupal.com as well as here on Agaric.coop, is made possible thanks to these generous sponsors. Contact Understand Drupal if your organization would like to support this documentation project, whether it is the migration series or other topics.
Find It makes it easier for a small team in government to make sure that there are resources available for a variety of residents' needs.
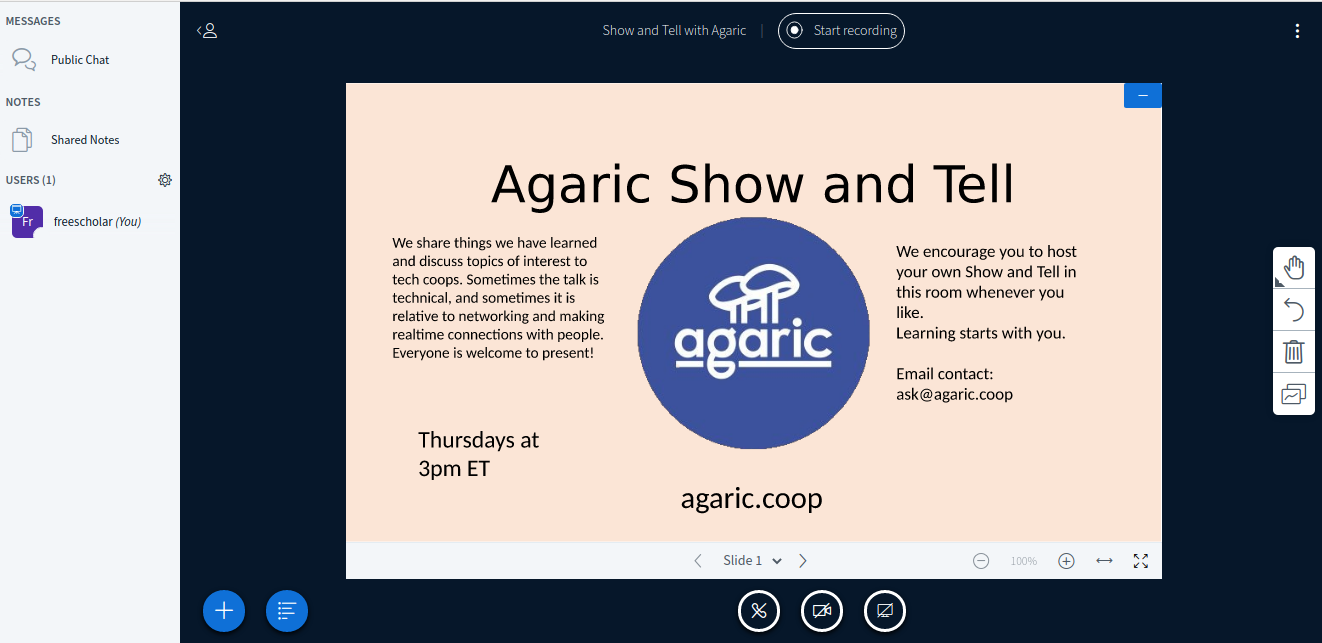
We can look at the recent popularity of some widely used platforms like Zoom and ask ourselves some questions as to why we still use them when we know a lot of terrible things about them. Agaric prefers to use a free/libre video chat software called BigBlueButton for many reasons, the first one being the licensing, but there are many reasons.
Zoom has had some major technology failures, which the corporation is not liable to disclose. At one point, a vulnerability was discovered in the desktop Zoom client for MacOS that allowed hackers to start your webcam remotely and launch you into a meeting without your permission. The company posted a note saying that they fixed the issue. Unfortunately, the Zoom source code is proprietary and we are not even allowed to look at it. There is no way for the community to see how the code works or to verify that the fix was comprehensive.
The Zoom Corporation stated early on that the software was encrypted end-to-end (E2EE) from your device to the recipient's device. This was untrue at the time, but the company states that it has been corrected for users on their client app. While it is no longer true that E2EE is unsupported, it does require that you use the proprietary Zoom client for E2EE to work. Without E2EE, any data that is retrieved on its way from your computer to a server can be accessed! The only real security is knowing the operators of your server. This is why Agaric uses trusted sources like MayFirst.org for most of our projects and we have a relationship with our BigBlueButton host. The Intercept also revealed that Zoom users that dial in on their phone are NOT encrypted at all
BigBlueButton does not have a client app and works in your browser, so there is no E2EE. The idea for E2EE is that with it, you "do not have to trust the server operator and you can rely on E2EE" because the model implies that every client has keys that are protecting the transferred data. However: you MUST still use a proprietary client in order to get the benefits of E2EE support, so once again you MUST trust Zoom as you have no permission to examine the app to determine that the keys are not being shared with Zoom.
Of course there is always the fact that hackers work day and night to corrupt E2EE and a Corporation is not obligated to tell you the customer every time there has been a security breach, and this information is usually buried in the terms of service they post - sometimes with a note saying the terms are subject to change and updates. A Corporation is not obligated to tell you, the customer when there has been a security breach" unless any personal information is exposed. There are now mandatory timely disclosure requirements for all states: https://www.ncsl.org/research/telecommunications-and-information-technology/security-breach-notification-laws.aspx ...Can Zoom really be trusted? As with some laws, the fine that is applied is low and affordable and subject to the interpretation of the courts and the status of knowledge your lawyer is privvy to - meaning most Corporations normally have a battery of lawyers to interpret the law and drag the case out until you are... broke.
In the case of BigBlueButton encryption, E2EE would only make sense if there are separate clients using an API to connect to the BBB server so a user does not have to trust the BBB server operator. If the user trusts the server operator, then there would be no need for E2EE." Lesson learned: It is always best practice to know and trust your server hosts as they are the ones that have the keys to your kingdom.
Some technology analysts consider Zoom software to be malware. Within companies that use Zoom, employers are even able to monitor whether or not you are focusing on the computer screen during meetings which seems excessively intrusive. Speaking of intrusive, the Zoom Corporation also shares your data with FaceBook, even if you do not have a FB account - that could be a whole blog in itself, but just being aware of some of the vulnerabilities is a good thing to pass on. Some of the bad stuff remains even if you uninstall the Zoom app from your device! Even though a class action suit was filed over privacy issues, the company stock still continued to rise.
Those are many reasons why we do not support Zoom. But there are also many reasons why we prefer BBB over Zoom. Besides, BBB has many great features that Zoom lacks:
1. Easily see who is speaking when their name appears above the presentation.
2. Chat messages will remain if you lose your connection or reload and rejoin the room.
3. Video is HD quality and you can easily focus on a persons webcam image.
4. Collaborative document writing on a shared Etherpad.
5. Easily share the presenter/admin role with others in the room.
6. Write closed captions in many languages, as well as change the language of the interface.
7. An interactive whiteboard for collaborative art with friends!
One huge advantage of free software, like BBB, is that you can usually find their issue queue where you can engage with the actual developers to report bugs and request feature enhancements. Here is a link to the BigBlueButton issue queue.
So, why do people keep using a platform like Zoom, even though there are many features in BigBlueButton that are much better?
There is very little publicity for free software and not many know it exists and that there are alternative solutions. You can find some great suggestions of software and switch to it by using this site called switching.software. The marketing budget for Zoom is large and leads you to believe it has everything you will need. Sadly their budget grows larger everyday with the money people pay for subscriptions to the platform. As a result, many people go with it as it is already used by their friends and colleagues, even though there are reports of irresponsible behavior by the Zoom Corporation. This is why the New York school system does not use Zoom and many organizations are following suit. The company gives people a false sense of security as it is widely used and very popular.
Of course, there are reasons to avoid other proprietary chat platforms too...
Agaric offers BigBlueButton for events and meetings. Check out our fun BBB website at CommunityBridge and test drive the video chat yourself!
If this discussion interests you, please share your thoughts with us in the comments.
Looking to learn more about problems with Zoom? There are a lot of articles about Zoom scandals.
- If you need to leak a zoom video without being identified, you need to be very careful!
- Zoom censorship of Palestine seminars sparks fight over academic freedom
- Zoom encryption is not suited for secrets
- Zoom is unclear about whether or not the app is actually end-to-end encrypted, which it isn't.
- And, yes - the wikipedia page has a good summary of some issues
- Stallman provides resources on what is bad about Zoom also
Looking to learn more about protecting your privacy online? These links have some helpful information and videos for tech-savvy people and organic folks alike!
2021 could be the year we all begin to STOP supporting the Corporations that oppress us.
Special thanks to Keegan Rankin for edits!
Ayudamos a las organizaciones a cumplir sus objetivos y fortalecer el movimiento de software libre al proporcionar consultoría en estrategia de tecnología en línea, al crear y personalizar software de alta calidad, capacitar a personas y hablar en eventos.
Estrategía

Utilizamos los principios de justicia de diseño para ayudar a que su presencia en línea alcance sus objetivos y tenga un impacto en el mundo real.
- Formación analítica
- Gobernanza del contenido
- Estrategia de contenido
- Operaciones de contenido
- Estrategia de redes sociales
Desarrollo

Construimos con un software probado que le da poder y control sobre su sitio web y presencia en línea.
- Desarrollo de la gestión de relaciones constituyentes (CRM)
- Migración de contenido
- Desarrollo drupal
- Desarrollo de Django
- Optimización de la donación
- Posicionamiento en buscadores (SEO orgánico)
- Integración de redes sociales
- Seguridad del sitio web y CRM
- Mantenimiento del sitio web
- Afinación del rendimiento del sitio web
- Actualización del sitio web
Usamos y contribuimos con el software libre siempre que sea posible, Creative Commons licencia nuestra documentación y trabajamos bajo un modelo de organización abierta.
Capacitación

Asesoramos y enseñamos, aprovechando su experiencia actual.
- Asesoramiento personalizado uno a uno
- Introducción a Drupal
- Desarrollo del módulo drupal.
- Migración drupal
- Seguridad en linea
Obtenga más información sobre las oportunidades para recibir capacitación de Agaric.
Speaking

Compartimos nuestros conocimientos y promovemos el software libre hablando en eventos.
Los temas incluyen:
- Cómo participar en el Común Digital
- Financiamiento efectivo y gobernanza para el software libre
- Ética en la tecnología
- Software Libre = Sociedad Libre
- Economía solidaria
- Desarrollo cooperativo
- Inteligencia Artificial y Vigilancia
- Poder personal
- Drupal - Comunitario y Técnico
Reserve con nosotros para un próximo evento.