350.org
Equipping climate justice activists with mobilization tools.
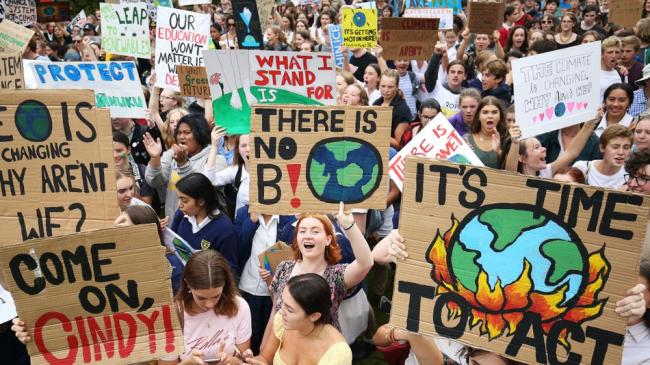
350.org is a global climate justice organization that helped organize the largest climate strike in history. Together we improved their Climate Justice Action Map (CJAM) in the lead up to the strike so that activists could better mobilize their communities.
The Challenge
350.org needed their mapping tool to convey the impressive breadth of the climate strike while quickly surfacing events near supporters. Mostly through volunteer power they had an initial version of the tool running, but it lacked the features needed for organizers to mobilize on the scale the climate strike demanded.
We worked with the 350.org Product Team to refactor the custom Javascript to use React.js, a popular and easy to use framework, add embed code parameters for organizers, and improve the user experience for climate strikers. The result was a tool that helped bring out an estimated 4 million people in possibly the largest climate justice action in history.
About the Map
The Climate Justice Action Map (CJAM) is a custom mapping tool that pulls 350 events and groups from multiple data sources (eg: ActionKit, EveryAction, CiviCRM) and displays an interactive map supporters can use to get involved.
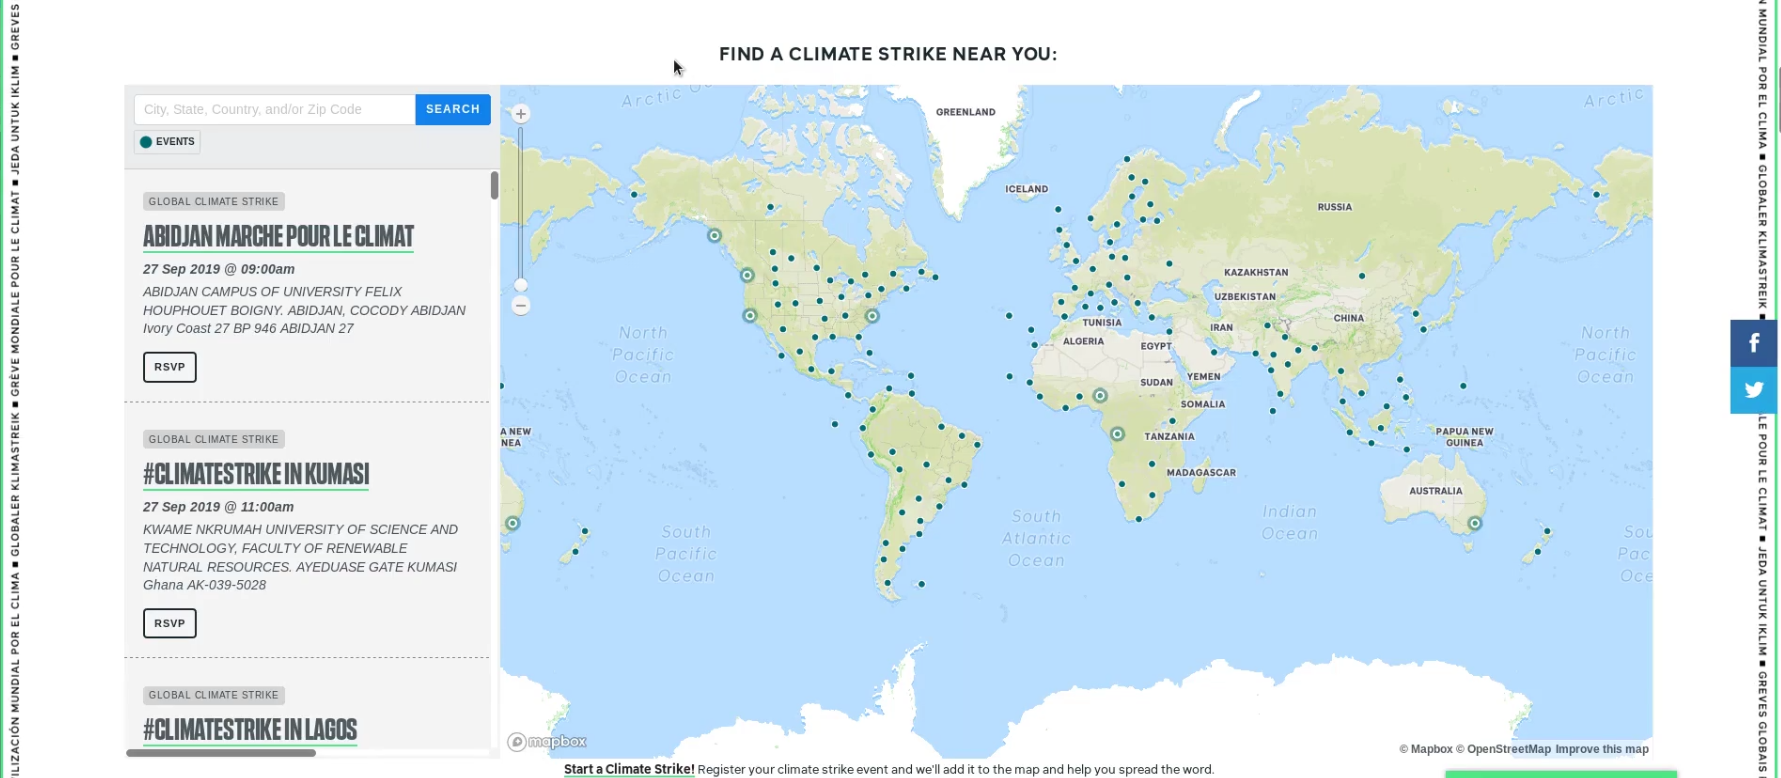
It can be embedded within websites with many customization options (eg: preset the map center to a location,, show the map’s text and buttons in a different language, show only events related to a particular campaign, etc.).
It uses Mapbox for the map, OpenStreetMaps for the tileset, and Google Maps for the search lookup.
The CJAM Extract, Transform Load (ETL) Application is a data processor written in Python that runs every 15 minutes and pulls in data from those many sources (eg: EveryAction, CiviCRM) via APIs and direct SQL queries. It writes the combined event and group data to a JSON data file hosted on Amazon S3, which is then consumed by the CJAM JavaScript.
Our Approach
We met with 350 in mid-June, with the strikes set for September 20th and organizing pushes in July and August. With tight deadlines, a new team and a new codebase, we quickly got to work understanding the goals of the map, its current implementation and what needed to be done for each milestone.
Users First - Getting Clear on the Goals
On projects demanding quick turnarounds it's tempting to dive head first into the issue queue. We know though, that a project is only successful if everyone is aligned on the overall goals of the project. Luckily, the product team already had excellent documentation (they even had a slideshow!) on what the purpose of the climate action map and its key audiences.
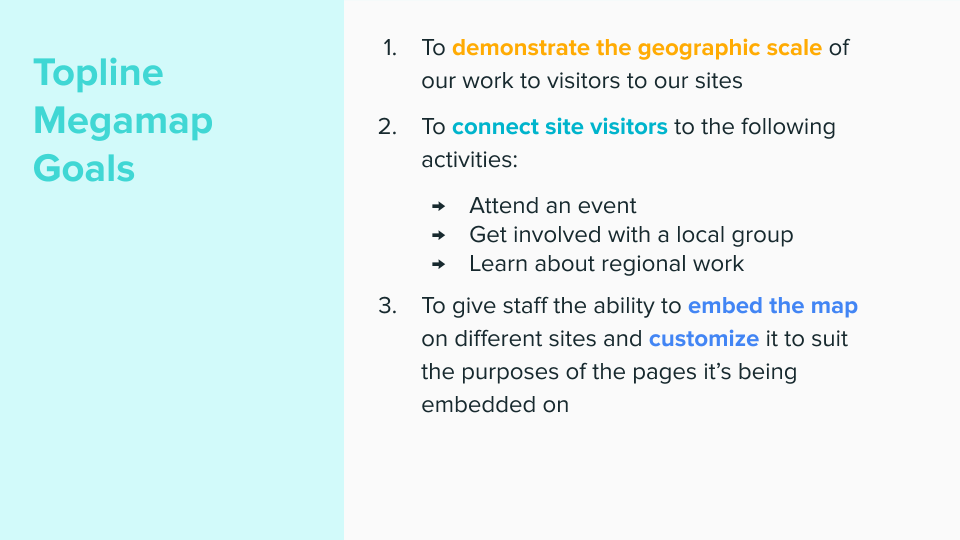
350.org had a slideshow detailing the goals and audiences, helping us gain the background knowledge needed to effectively collaborate.
Goals
- To demonstrate the geographic scale of our work to visitors
- To connect site visitors to the following activities:
- Attend an event
- Get involved with a local group
- Learn about our regional work - To give staff the ability to embed the map on different sites and customize it to suit the purposes of the pages it's being embedded on.
Key Audiences
- Site Visitor
- Map Embedder
These documents were great to have coming into our kickoff call.
Refactor While Learning
Getting familiar with the inner workings of the climate action map was particularly challenging because the code was essentially in two states: the main branch with the original custom JavaScript and a refactor branch where the transition to React.js was happening. React is one of the most popular and widely used frameworks. Converting the application to React made the code easier to maintain and build upon. The original volunteer developer had begun this process of conversion and there were new features written in the new React way, unavailable until the refactoring was complete.
Mauricio and Chris met with him to get clear on how to see the transition to the end. They then set to familiarizing themselves with the codebase and refactoring along the way. By understanding, for example, a long complex function, and then rewriting it into smaller discrete functions, we were able to simplify the code, wrap our head around its inner workings and make it easier to work with for the next developer to join the project.
Debugging Woes
When first working with a codebase it takes time to understand why a new change isn't sticking or why an error is occurring. Logs are a developer's best friend when it comes to debugging. Unfortunately, the logging available was stark. The ETL had a running log, but wasn't saving to a file for future reference or easy retrieval. Chris made the error log easy to reference and even added Slack integration sending a message to the team whenever an error occurred - helping people quickly respond to issues.
Strike Globally, Mobilize Locally
350.org has hundreds of chapters, spread across seven continents, with members speaking dozens of languages. Their mapping tool was built with this diversity in mind. It serves as a powerful storytelling device (goal number one), with a single map conveying the impressive reach of the movement, and not making assumptions as to where a visitor is or what they're looking for.
On the other hand, mobilizing is most effective when it comes from people we know, from communities we're part of. As such, the map can live in more localized contexts, showing just events and groups relevant to a particular scenario. For example, the 350 Colorado chapter can display a map zoomed into the Mountain West, while 350 France can show a map with just events in French.
These custom maps are created using embed parameters. To do this, a 350.org organizer pasted the map onto a page using an iframe, passing in parameters such as language, location and data source by including a query parameter in the url.
However, this approach was cumbersome, technically prohibitive and error prone. We dropped the iframe approach and replaced it with a series of shortcodes, a more intuitive method, that make direct calls to the Climate Action Map API to render a map specific to an organizer's needs.
We added support for the following short codes:
- data-src-search - pass in a location search term and the map will pre-search to that location event-campaign - show only results tagged with a specific campaign, eg: ‘climate strike’
- date-range-start - show events that start on or after a certain date
- date-range-end - show events that end before or on a certain date
- data-src-lang - show map text in a certain language
- data-src-latlong - center the map at a certain latitude and longitude point
- data-src-zoom - set the default zoom level
- data-src-layers - specify which kind of data to show (campaign, event, group)
Now organizers can create any number of maps with criteria meeting their campaign or community's specific needs.
What Exactly is the "Future"? - Calculating Timezones with Python
With so many different events happening at any given time, the map risked overwhelming visitors looking to get involved. 350.org's designer Matthew Hinders-Anderson came up with the solution of applying different map pin styles to events depending on when they were happening. Past events have a subdued teal, while current and future events have a strong teal. To emphasize the storytelling (goal number) of the map, current events throb.
To accomplish this, we needed to calculate an event's date and time relative to the current time. Unfortunately, many of the events had no timezone associated with them. However, they did all have some form of location available. Chris found a handy Python tool called timezonefinder that calculates an event's timezone based on latitude and longitude.
With the timezone in hand, Mauricio could then apply the different colors (and flashing) based on the event's time relative to now.
We used Python to calculate an event's timezone based on its latitude and longitude.
Seamless Onboarding
With so many events organized, we wanted potential strikers to find an event to attend quickly. Map embedders found though, that sometimes searches would result in an empty map, despite events being nearby. This is one of the many challenges of designing interactive maps. One example was a visitor living in a nearby suburb of Boston. A search for Allston would turn up nothing, despite there being multiple events within a 5 mile radius. We fine tuned the zoom in behavior to better show nearby events.
There were still edge cases though. We addressed this by showing a "Zoom out" button if a visitor came up empty. Clicking that zooms a user out to the nearest result.
If a visitor gets no results from their search, they can zoom out to the nearest event or group.
The Results
The mobilization plan was to push activists and organizers to plan events from June through August. Then rally as many people to RSVP to the newly created events from August up until the big days: September 20th and September 27th. We rolled out the embed code functionality in August which organizers put to good use, embedding local and regional specific maps on local 350 group pages and climate strike specific websites they had built.
The map was so popular, that other organizations asked if they could embed it on their own sites - increasing the mobilization points and audiences reached. That we were able to do this speaks to the importance of defending the open web and free and open source software that allows for the decentralized sharing and using of tools.
On the first day of the strikes the pin styles came to life, lighting up the many walkouts, rallies and protests happening that day. It was a go to graphic for journalists and supporters on social media to share when reporting on the unprecedented participation.
Ultimately, the numbers we saw was a testament to the long, hard work organizers constantly engage in and the urgency of the moment we are in. However, with tools like the Climate Justice Action Map, built by technology activists alongside the organizers using them, we deepen and widen the mobilizing possible. And in these times of massive wealth inequality, deep political corruption, and closing window of time for the bold action we need, disrupting the status quo is more important than ever before.
Special thanks to the 350.org product team members Kimani Ndegwa, Matthew Hinders-Anderson, Nadia Gorchakova, and suzi grishpul for their vision, management of the project and design and development leadership.
350.org
2019
launched
ActionKit, CiviCRM, EveryAction, MapBox, Python, and React.js
design and development
Chris Thompson, Mauricio Dinarte, and Clayton Dewey
350.org Product Team: Kimani Ndegwa, Matthew Hinders-Anderson, Nadia Gorchakova suzi grishpul